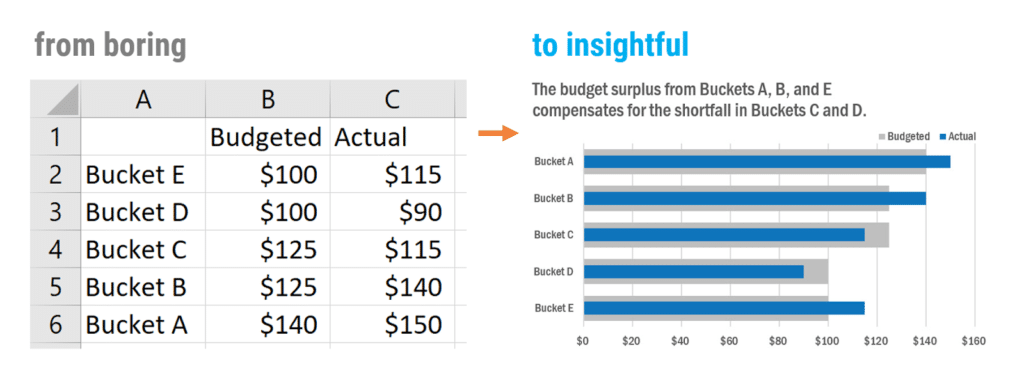
Excel may not be exactly user-friendly, BUT you own it and can master graph-making in it with the Chart Starter Series of tutorials. Use the tools you have to make compelling visualizations for reports, slides, handouts, and dashboards.

The Chart Starter Series equips you with the 10 lessons you’ll most need to massively improve your graph-making skills in the shortest amount of time. The Data Visualization Academy has dozens and dozens of chart tutorials but I packaged together the graphs I implement most commonly with the organizations I consult with around the world. You’ll get a quick jumpstart on charts and graphs with the Chart Starter Series.